Warming across Australia
NASA POWER and BoM ACORN-SAT show warming nationally and in all seven comparable regions over 1981–2025. The national and regional analysis extends an earlier study at one location.
Explore the temperature comparisonNASA SPACE APPS · EARTH SYSTEM TREND DETECTIVE
Does the trend hold up?
A climate data investigation for students and teachers. Compare Australian records and decide how much confidence to put in a trend.
National Sen slopes in °C per decade · Exploratory analysis
Compare NASA POWER with the Bureau of Meteorology
Choose a variable, region, and at least ten matched years. Compare each record’s estimated trend and how uncertain it is.
The summarizes change over time. The belongs to the separate linear fit and accounts for year-to-year dependence.
See the methods behind this result · Download trend estimates
Research findings
NASA POWER and BoM ACORN-SAT show warming nationally and in all seven comparable regions over 1981–2025. The national and regional analysis extends an earlier study at one location.
Explore the temperature comparisonOver 2000–2025, POWER’s estimated annual rainfall total fell by 53.2 mm per decade. BoM AGCD’s estimate was near flat at +5.2 mm per decade. The POWER result is sensitive to how the analysis accounts for related years.
Compare the rainfall recordsFour products offer different views of Central Australia. Their annual analyses leave the long-term local rainfall and evaporation trends uncertain.
Explore the local recordsWe compared annual records over matching years and checked how statistical assumptions affected the results. Read the methods and review · View sources and downloads
Study design
We started near 25.3°S, 133.8°E with a preregistered NASA POWER temperature test and a secondary rainfall test. We expanded the temperature analysis to see whether warming also appeared across Australia.
The original point’s temperature trend was +0.256 °C per decade (Sen slope, 1981–2025). The preregistered test applies to this location.
The exploratory national analysis estimates +0.218 °C per decade. BoM’s station-derived record estimates +0.244 °C per decade over the same years.
The national estimate weights land cells by latitude. The BoM comparison shows that a separately produced record has a similar warming trend.
See the annual and regional comparisonsTemperature · 1981–2025
NASA POWER combines observations and a physical model in a reanalysis. BoM ACORN-SAT uses homogenized station observations. Both show a positive trend across all seven comparable regions.
Change from each record’s own 1981–2010 mean · °C
The national and regional comparisons are exploratory. Neighboring grid cells are spatially related, and the two products can share underlying information.
New South Wales had the largest estimated warming slope in both records. The Northern Territory had the smallest. The national estimates use area weighting across the land grid.
| Region | NASA POWER | BoM ACORN-SAT |
|---|---|---|
| New South Wales | +0.307 | +0.318 |
| Northern Territory | +0.141 | +0.130 |
| Queensland | +0.252 | +0.296 |
| South Australia | +0.279 | +0.285 |
| Tasmania | +0.226 | +0.139 |
| Victoria | +0.268 | +0.222 |
| Western Australia | +0.167 | +0.250 |
BoM’s NSW series includes the ACT. The POWER grid has no ACT cell at this resolution.
Separate linear estimates with 95% confidence intervals that account for year-to-year dependence. All values are in °C per decade for 1981–2025.
Rainfall · 2000–2025
POWER estimates a decline in national rainfall over this period. The gauge-informed BoM AGCD series is near flat, so it does not corroborate the decline.
National area average · millimetres per year
Sen slopes in millimetres of annual rainfall per decade.
NASA POWER estimates a decrease of 53.2 mm of annual rainfall per decade. BoM’s Sen slope is +5.2 mm. All four POWER block-bootstrap intervals include zero.
Subtract each year’s BoM total from the corresponding NASA POWER total. Values below zero mean POWER estimated less rainfall that year.
This exploratory comparison describes how the two records differ. The study does not establish the cause of that difference.
Rainfall in neighboring years can be related. We resampled consecutive blocks of years and checked how the result changed as the blocks grew longer.
Each interval crosses zero, including the two-year interval. The chart uses annual mean rainfall rates in mm/day. The comparison above uses annual rainfall totals.
| Method | Result |
|---|---|
| Linear trend with HAC errors | Raw p = 0.024; adjusted q = 0.044 in the three-outcome comparison |
| Bootstrap with 2-year blocks | Interval includes zero |
| Bootstrap with 3–5-year blocks | Each interval includes zero |
The analysis uses 5,000 bootstrap draws per block length. The BoM rainfall comparison gives a near-flat slope and a raw p-value of 0.833.
Three rainfall records · 2000–2024
We added NASA GPM IMERG monthly rainfall across Tasmania and Queensland and reran all three records for the same 25 complete years. IMERG combines satellite estimates with gauge information. Each product retains its own grid and spatial averaging method.
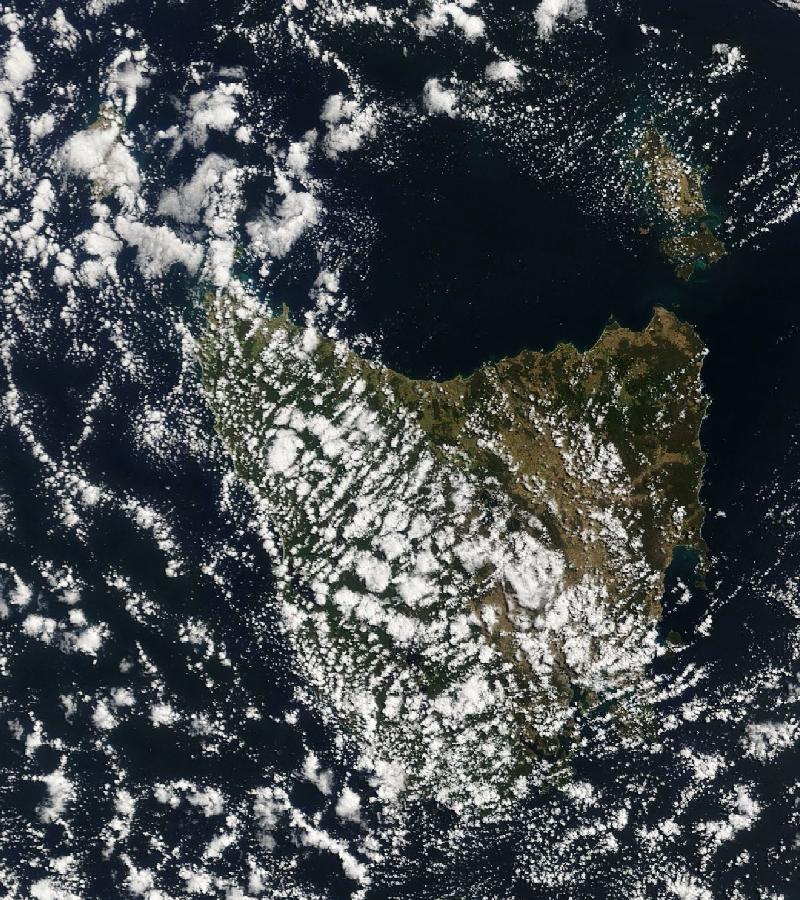
NASA Terra / MODIS true-colour imagery via NASA GIBS. This single-day view shows the geography of the study region. The rainfall analysis uses monthly data from 2000 to 2024.
View the scene in NASA WorldviewState average · millimetres per year
Trend values are in millimetres of annual rainfall per decade. The 95% intervals apply to the separate linear fits and are unadjusted for multiple testing. This is an exploratory comparison.
Exploratory follow-up
We compared all four seasons across 24 matched years (2001–2024) in Queensland and Tasmania. Summer is named for the year of January and February.
POWER estimates about 93 mm less winter rainfall per decade, compared with 24 mm in BoM and 30 mm in IMERG. Only the POWER winter trend passed the adjustment across 24 seasonal tests. The BoM and IMERG linear intervals both include zero.
All three records estimate wetter autumns. After adjusting for the seasonal tests, none provides strong enough evidence to establish a trend under the methods used here.
Removing POWER grid centres without land neighbours on all four sides leaves 8 of Tasmania’s 23 centres. The annual Sen slope changes from −128 to −195 mm per decade. Queensland’s estimate changes from −47 to −38. These comparisons describe sensitivity to the sampled locations.
Slopes and intervals use mm of seasonal rainfall per decade. Intervals apply to the separate linear fits. Adjusted q uses Benjamini–Yekutieli across all 24 tests.
| Region | Season | Record | Sen slope | 95% linear interval | Adjusted q |
|---|---|---|---|---|---|
| Queensland | Summer | POWER | -36.4 | -117.7 to +5.6 | 1 |
| Queensland | Summer | BoM | +2.4 | -54.0 to +44.9 | 1 |
| Queensland | Summer | IMERG | -8.6 | -64.7 to +28.3 | 1 |
| Queensland | Autumn | POWER | +19.0 | -22.0 to +41.1 | 1 |
| Queensland | Autumn | BoM | +35.5 | +7.7 to +48.6 | 0.31 |
| Queensland | Autumn | IMERG | +31.8 | -1.7 to +48.0 | 1 |
| Queensland | Winter | POWER | -4.6 | -21.4 to +6.4 | 1 |
| Queensland | Winter | BoM | +3.2 | -12.6 to +14.2 | 1 |
| Queensland | Winter | IMERG | +1.7 | -14.2 to +14.1 | 1 |
| Queensland | Spring | POWER | +1.0 | -29.1 to +24.9 | 1 |
| Queensland | Spring | BoM | +18.1 | -9.7 to +36.9 | 1 |
| Queensland | Spring | IMERG | +19.9 | -8.4 to +42.1 | 1 |
| Tasmania | Summer | POWER | -7.5 | -24.0 to +12.6 | 1 |
| Tasmania | Summer | BoM | -3.4 | -31.7 to +16.0 | 1 |
| Tasmania | Summer | IMERG | +9.0 | -21.5 to +30.2 | 1 |
| Tasmania | Autumn | POWER | -26.1 | -43.2 to +21.3 | 1 |
| Tasmania | Autumn | BoM | +20.5 | -14.8 to +62.0 | 1 |
| Tasmania | Autumn | IMERG | +17.6 | -16.4 to +63.8 | 1 |
| Tasmania | Winter | POWER | -92.5 | -122.8 to -60.1 | 9.82e-07 |
| Tasmania | Winter | BoM | -24.0 | -68.0 to +31.2 | 1 |
| Tasmania | Winter | IMERG | -29.5 | -74.0 to +13.7 | 1 |
| Tasmania | Spring | POWER | -36.4 | -68.8 to +3.1 | 1 |
| Tasmania | Spring | BoM | -17.3 | -48.2 to +18.5 | 1 |
| Tasmania | Spring | IMERG | -16.3 | -36.6 to +13.3 | 1 |
2000–2024 · mm of annual rainfall per decade · unadjusted intervals for the separate linear fits.
| Region | Grid selection | Cells | Sen slope | 95% linear interval |
|---|---|---|---|---|
| Queensland | All centres | 483 | -47.4 | -175.7 to +42.4 |
| Queensland | Interior only | 433 | -38.0 | -167.1 to +39.6 |
| Tasmania | All centres | 23 | -127.8 | -184.1 to -75.8 |
| Tasmania | Interior only | 8 | -195.2 | -269.0 to -144.4 |
Seasonal totals · Seasonal trends · Coastal sensitivity · Sources and methods
Central Australia · near 25.3°S, 133.8°E
These products describe rainfall and water loss near the original study point. Their annual analyses did not establish a long-term trend for the variables shown here.
2010 had the largest positive annual anomaly and 2019 had the lowest annual value in the analyzed record. POWER also shows a wet 2010 and a dry 2019 near the study point.
The estimated slope is −0.081 mm/day per decade over 2000–2025. The uncertainty interval for the separate linear fit spans zero.
The estimated slope is +0.036 mm/day per decade at one 500 m pixel over 2001–2024. Admitting three additional composites with backup quality flags leaves the interpretation unchanged.
Both local estimates slope slightly downward over 2000–2024. Both linear trend intervals span zero. The chart shows the two variables in the same units.
Methods and review
The original NASA POWER study preregistered a temperature test and a secondary precipitation test for a single point. It used Mann–Kendall tests with a Bonferroni adjustment across those two outcomes.
The later exploratory analysis weighted grid cells by latitude and annualized monthly data using calendar days. We compared the resulting national and regional records with BoM over matching years.
Sen slopes summarize trends. Confidence intervals and adjusted p-values in the evidence files come from separate linear fits using Newey–West standard errors. The national analysis cannot establish the causes of the trends.
For each of 2,218 land grid centres, we fit a linear temperature trend with Newey–West uncertainty and applied the Benjamini–Yekutieli correction across the grid. The map highlights cells with adjusted q < 0.05. A cell’s colour in the rate view shows its Sen slope.
Local audits reproduced key calculations and checked the boundary and MODIS processing. Roundtable used AI-assisted cross-review. Read the Roundtable review record.
What the comparison found
NASA POWER and BoM both show national warming from 1981 to 2025. For rainfall, the direction and strength of the evidence depend on the region and the record.
From 1981 to 2025, NASA POWER estimates warming of +0.218 °C per decade across 2,218 land grid centres. The Bureau of Meteorology’s station-based record estimates +0.244 °C per decade over the same years. Both records estimate warming in all seven regions we compared. The rates vary by region.
From 2000 to 2025, NASA POWER estimates a decline of 53.2 mm of annual rainfall per decade. BoM’s estimate is close to flat at +5.2 mm per decade. When we resampled consecutive years in blocks of two to five, every POWER rainfall interval included zero. The result warrants a closer look by region.
Over the same 25 complete years, NASA IMERG’s estimates were closer to BoM’s in both states. In Queensland, the three estimates point in different directions and all three confidence intervals include zero. In Tasmania, all three estimates point toward drying, but POWER shows a much steeper decline and the BoM and IMERG intervals include zero.
Tasmania’s winter shows the clearest decline in POWER, with weaker estimated declines in BoM and IMERG. Changing the land sample shifts the Tasmania annual estimate substantially. Explore the seasonal and coastal results.
Download the corrected findings (PDF) · Browse the reports, data and audits
Search the live NASA catalogue for dataset descriptions and access links. The trend explorer uses the project’s prepared records.
This guide answers supported questions from the project’s data and glossary. It runs in your browser.
Evidence and downloads
ChatGPT/Codex assisted with the website and analysis code. Roundtable used model APIs to review the earlier analysis. The charts and data tables are calculated from the cited measurement and reanalysis records.